Annual Reports Archive
 The New Jersey Beach Profile Network (NJBPN) was authorized by the New Jersey Department
of Environmental Protection (NJDEP) in 1986. The report is divided into coastal County
segments with a summary of beach changes dominating the county coast. Any major beach
restoration or hard structure project is reviewed for performance and effectiveness.
A discussion of issues and pending project work in the county follows as a final segment.
These observations on beach changes along the New Jersey coastline provide a means
to determine both rapid seasonal changes and follow long-term trends in shoreline
position or beach volume. The advent of major shore protection projects resulting
in the addition of millions of cubic yards of new sand has given a performance monitoring
aspect to the report. The 171 sites extend from the lower Raritan Bay, along the
four oceanfront county shorelines and into Delaware Bay along the western shore of
Cape May Co.
The New Jersey Beach Profile Network (NJBPN) was authorized by the New Jersey Department
of Environmental Protection (NJDEP) in 1986. The report is divided into coastal County
segments with a summary of beach changes dominating the county coast. Any major beach
restoration or hard structure project is reviewed for performance and effectiveness.
A discussion of issues and pending project work in the county follows as a final segment.
These observations on beach changes along the New Jersey coastline provide a means
to determine both rapid seasonal changes and follow long-term trends in shoreline
position or beach volume. The advent of major shore protection projects resulting
in the addition of millions of cubic yards of new sand has given a performance monitoring
aspect to the report. The 171 sites extend from the lower Raritan Bay, along the
four oceanfront county shorelines and into Delaware Bay along the western shore of
Cape May Co.
The photographs, cross sections, trend charts, and text focus on the seasonal and year to year changes observed since the previous report. These reports show the following:
- The enormous positive impact of beach nourishment over the past 24 years.
- The enhanced shoreline protection benefits of 24 years of dune growth in height and width.
- The importance of the inlet processes and their impact on changes on adjacent beaches.
- The ability to analyze causes of extreme variations at specific sites on the coast.
- The pattern of sand distribution along barrier islands as determined by that island’s profiles.
- The beneficial results of the low incidence of serious storm events impacting the NJ coast.
- The ability to gage the impact of Declared Disaster events on the NJ coastline.
Archived Content Notice
The reports provided on this page are part of Stockton University’s web archive. These documents were created prior to April 24, 2026, are no longer updated, and are maintained solely for historical reference, research, and recordkeeping purposes. As archived content, these PDFs may not fully meet current WCAG 2.1 Level AA accessibility standards.
If you need an accessible version of any report or an equally effective alternative, Stockton University will provide one upon request in a timely manner. Please contact Coastal Research Center at crc@stockton.edu.
2020 New Jersey Beach Profile Network Annual Report
2020 Annual Reports (PDF):
The digital monitoring of the New Jersey oceanfront shoreline commenced 35 years ago in the fall of 1986.
The New Jersey Department of Environmental Protection asked The Stockton University Coastal Research Center (CRC) to establish topographic cross section transects along the NJ oceanfront and parts of the Raritan and Delaware Bay shorelines to provide information about changes occurring in the dunes, on the beach, and nearby offshore seafloor along the Jersey shore.
Work began as an annual oceanfront and Raritan and Delaware Bay shoreline survey in the fall between 1986 and 1993, then switched to a spring and a fall survey at each site in 1994. This allowed the CRC to summarize winter storm damage each spring and review beach accretion following the summer season.
Today, the CRC surveys a total of 171 sites, twice a year, with the results summarized in this annual report.
2019 New Jersey Beach Profile Network Annual Report
2019 Annual Reports (PDF):
Thirty-four years ago, the New Jersey Department of Environmental Protection asked The Stockton University Coastal Research Center to establish topographic cross sections along the NJ oceanfront and parts of the Raritan and Delaware Bay shorelines to provide information about changes occurring in the dunes, on the beach and nearby offshore seafloor along the Jersey shore. This project commenced as an annual oceanfront and Raritan and Delaware Bay shoreline survey only in the fall between 1986 and 1993, then switched to a spring and a fall survey at each site in 1994. This allowed the CRC to summarize winter storm damage each spring and review beach accretion following the summer season. The 2019 report is divided into four coastal county segments and gives a summary of beach changes in each county.
The US Army Corps of Engineers (USACE) has established coastal shore protection projects along 100% of the 97 miles of New Jersey’s developed oceanfront shoreline with the NY District responsible for Raritan Bay efforts and the oceanfront from Sandy Hook National Seashore, south to Manasquan Inlet. The Philadelphia District has jurisdiction from Manasquan Inlet south to Cape May Point and into Delaware Bay. Currently, the only segment where construction of the selected shore protection effort has yet to be undertaken encompasses North Wildwood to Lower Township (The Wildwoods). This project continues to evolve as limitations on sand supplies, real estate ownership and methodology for the project are worked out among the stakeholders.
Over the years additional survey sites were added to gain a better perspective on changes around the 11 NJ tidal inlets with a station in close proximity to both inlet beachfront shores. A site was added in 2016 on Sandy Hook closer to the northern end of the spit tip. In 2017 following discussions with the Division of Coastal Engineering (DCE) and the NY Corps of Engineers District, 66 sites were introduced between the 34 already located along the Monmouth County oceanfront to better follow changes occurring within the Monmouth County shore protection project shoreline. These were selected from existing NY District survey sites between the present NJBPN survey locations. The CRC installed or upgraded survey markers and backup monumentation at the new locations. These sites are distributed among the original 34 oceanfront locations. Including the three Raritan Bay sites, the number of NJBPN sites for Monmouth County is 102 (Figure 1a-d). The first survey of these new locations took place in the fall of 2017. These new sites were surveyed in the spring and fall of 2018. Today the CRC surveys 171 sites twice each year with the results summarized in these annual reports to the DCE.
2018 New Jersey Beach Profile Network Annual Report
2018 Annual Reports (PDF):
The New Jersey Department of Environmental Protection (NJDEP) collaborated with the
Stockton University Coastal Research Center (CRC) in 1986 to create the New Jersey
Beach Profile Network (NJBPN). This project commenced as an annual oceanfront and
Raritan and Delaware Bay shoreline survey in the fall between 1986 and 1993, then
switched to a spring and a fall survey at each site in 1994. This allowed the CRC
to summarize winter storm damage each spring and review beach accretion following
the summer season. The 2018 report is divided into four coastal county segments and
gives a summary of beach changes in each county.
The US Army Corps of Engineers (USACE) has established coastal shore protection projects
along 100% of the 97 miles of New Jersey’s oceanfront shoreline with the NY District
responsible for Raritan Bay efforts and the oceanfront from Sandy Hook National Seashore,
south to Manasquan Inlet. The Philadelphia District manages from Manasquan Inlet south
to Cape May Point and into Delaware Bay. Currently, the only segment where construction
of the selected shore protection effort has yet to be constructed encompasses North
Wildwood to Lower Township (The Wildwoods). Here, a project is under final implementation
processes at the District to complete work along the NJ shoreline.
2017 New Jersey Beach Profile Network Annual Report
2017 Annual Reports (PDF):
The New Jersey Department of Environmental Protection (NJDEP) collaborated with the Stockton University Coastal Research Center (CRC) in 1986 to create the New Jersey Beach Profile Network (NJBPN). This project commenced as an annual survey in the fall between 1986 and 1993, then switched to a spring and a fall survey at each site in 1994. This allowed the CRC to summarize winter storm damage each spring and review beach accretion following the milder summer season. This annual report is divided into four coastal county segments and provides a summary of beach changes for each county.
Following Hurricane Sandy, the US Army Corps of Engineers (USACE) undertook the restoration of the beaches and dunes to federally authorized design specifications. Funding under Public Law 113-2 allowed 100% federal payment for the restoration of existing storm reduction projects in Monmouth, Ocean, Atlantic, Cape May Counties, and the tidal Delaware Bay/River shoreline. The 2016 report documented completed hurricane restoration work as part of a 30-year review of the program.
2016 NJBPN Annual Report (30 Year Report)
2016 Annual Reports (PDF):
The New Jersey Department of Environmental Protection (NJDEP) initially authorized the New Jersey Beach Profile Network (NJBPN) project in 1986. With Hurricane Sandy now three years behind us, the continued challenges are examined as major State and Federal projects have gone to completion and been exposed to a few storm events since Sandy. The report is divided into four coastal county segments and provides a summary of beach changes for each county.
The US Army Corps of Engineers (ACOE) undertook the restoration to design specifications all federally authorized, and constructed shore protection projects in the State. Funding under Public Law 113-2 allowed 100% federal payment to do restoration of existing projects in Monmouth, Ocean, Atlantic, Cape May Counties, and the tidal Delaware Bay/River shoreline. While the direct impact of Hurricane Sandy was published on the Coastal Research Center (CRC) website as soon as it was complete in December 2012, it has taken several years to follow both the direct sand placement as well as the slower rate of natural accretion.
2015 New Jersey Beach Profile Network Annual Report
2015 Annual Reports (PDF):
The New Jersey Department of Environmental Protection (NJDEP) initially authorized the New Jersey Beach Profile Network (NJBPN) project in 1986. With Hurricane Sandy now three years behind us, the continued challenges are examined as major State and Federal projects have gone to completion and been exposed to a few storm events since Sandy. The report is divided into four coastal county segments and provides a summary of beach changes for each county.
The US Army Corps of Engineers (ACOE) undertook the restoration to design specifications all federally authorized, and constructed shore protection projects in the State. Funding under Public Law 113-2 allowed 100% federal payment to do restoration of existing projects in Monmouth, Ocean, Atlantic, Cape May Counties, and the tidal Delaware Bay/River shoreline. While the direct impact of Hurricane Sandy was published on the Coastal Research Center (CRC) website as soon as it was complete in December 2012, it has taken several years to follow both the direct sand placement as well as the slower rate of natural accretion.
2014 New Jersey Beach Profile Network Annual Report
 2014 Annual Reports (PDF):
The New Jersey Department of Environmental Protection (NJDEP) authorized the New Jersey Beach Profile Network (NJBPN) project in 1986. The report is divided into four coastal county segments and provides a summary of beach changes for each county. Since it has been over two years since Hurricane Sandy, the objective is to report on exactly how each shoreline segment has responded to both extensive restoration efforts and situations where beach/dune recovery were more natural process driven.
The US Army Corps of Engineers (ACOE) undertook the restoration to design specifications all federally authorized, and constructed shore protection projects in the State. Funding under Public Law 113-2 allowed 100% federal payment to do restoration of existing projects in Monmouth, Ocean, Atlantic, Cape May Counties, and the tidal Delaware Bay/River shoreline. While the direct impact of Hurricane Sandy was published on the Coastal Research Center (CRC) website as soon as it was complete in December 2012, it has taken several years to follow both the direct sand placement as well as the slower rate of natural accretion. Past reports are linked to the site so comparisons can be made to the 2012-2013 observations along the New Jersey coastline.
2013 New Jersey Beach Profile Network Annual Report
 2013 Annual Reports (PDF):
The New Jersey Department of Environmental Protection (NJDEP) authorized the New Jersey Beach Profile Network (NJBPN) project in 1986. The report is divided into four coastal county segments and provides a summary of beach changes for each county. Last year’s report focused on the magnitude of Hurricane Sandy’s impacts on the Jersey coast. After 18 months of all-out recovery efforts, this year the Coastal Research Center (CRC) will examine where, how and how well the recovery effort faired in returning the shoreline to pre-Sandy conditions.
The US Army Corps of Engineers (ACOE) undertook the restoration to design specifications all federally authorized, and constructed shore protection projects in the State. Funding under Public Law 113-2 allowed 100% federal payment to do restoration of existing projects. Both the New York District (Monmouth County) and the Philadelphia District (Ocean, Atlantic, Cape May Counties, and the tidal Delaware Bay/River shoreline) executed contracts for sand nourishment and structural repairs to existing work from the Hudson River, through Raritan Bay, down the Atlantic coastline and into Delaware Bay. Previous survey data has been compared to situations existing just after Sandy, 6-, and 12-months after the event. Seasonal changes are included, but largely in table form in the appendix. The individual site cross sections show four surveys, starting with April 2012 and ending with the fall of 2013. The direct impact of Hurricane Sandy was published on the Coastal Research Center (CRC) website as soon as it was complete in December 2012. This report attempts to show where intervention produced dramatic recovery results in contrast with other locations where natural recovery has had some influence.
2012 New Jersey Beach Profile Network Annual Report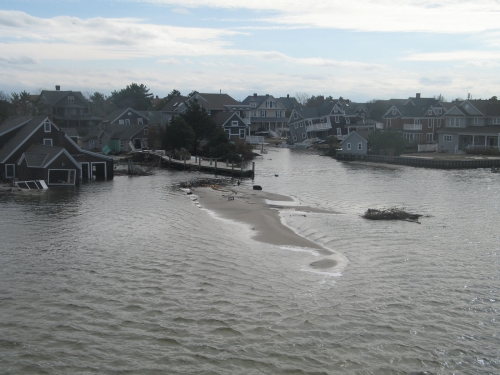
2012 Annual Reports (PDF):
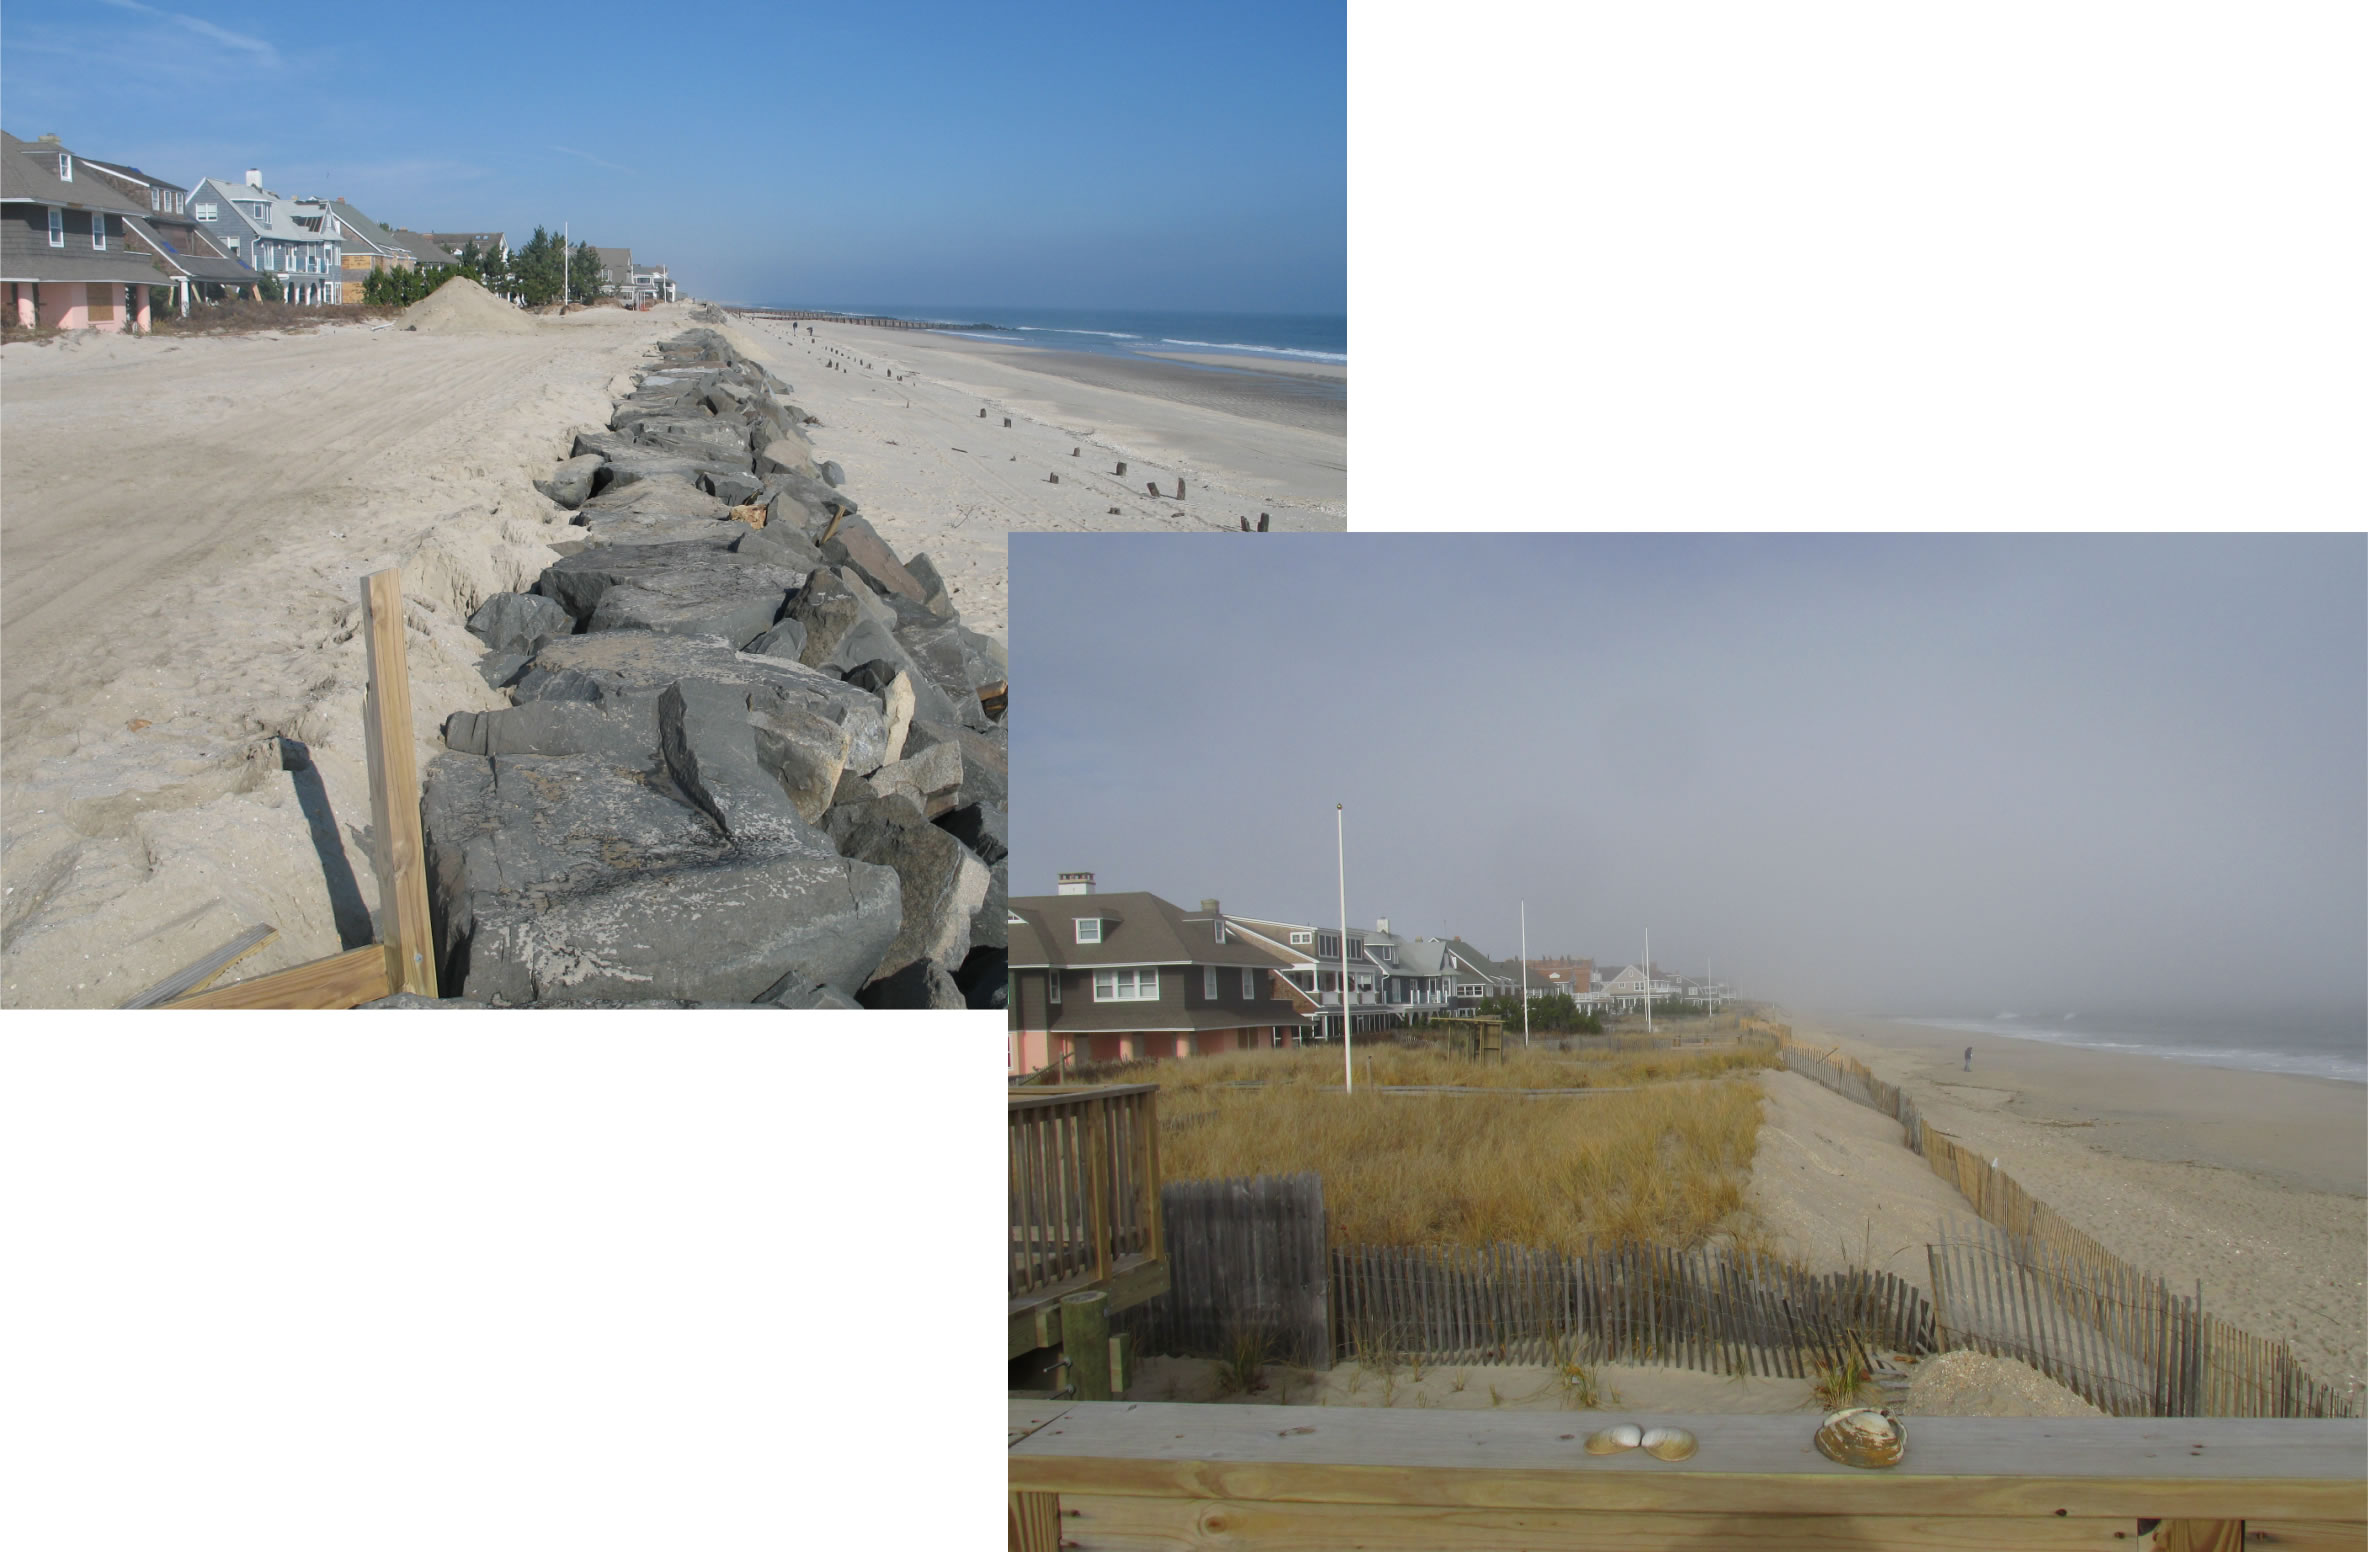
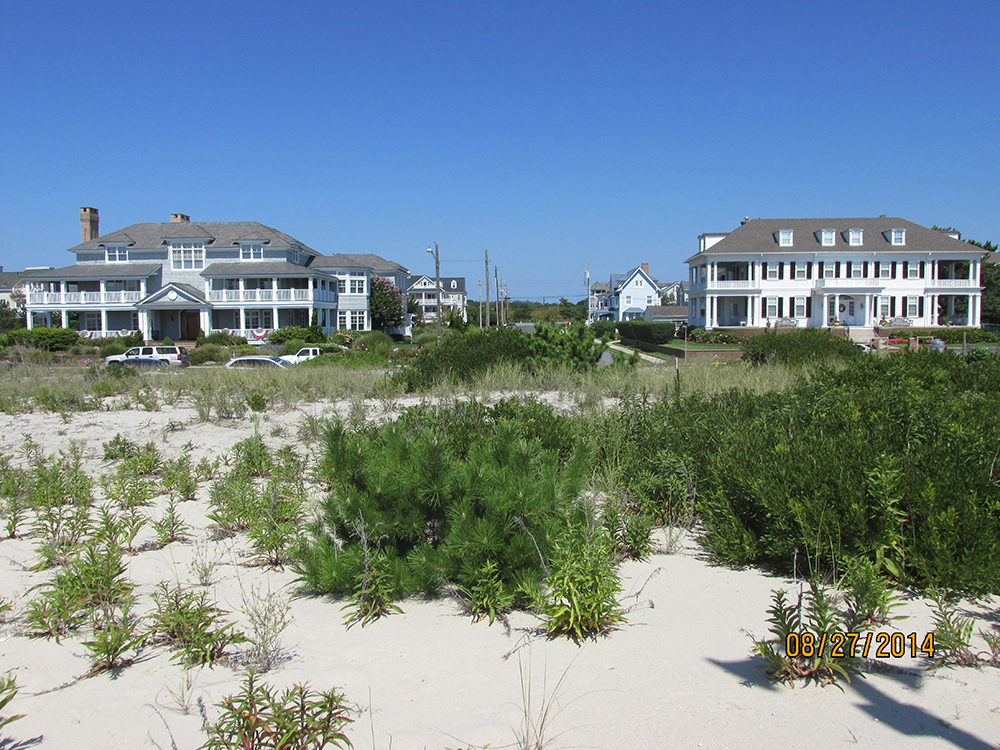
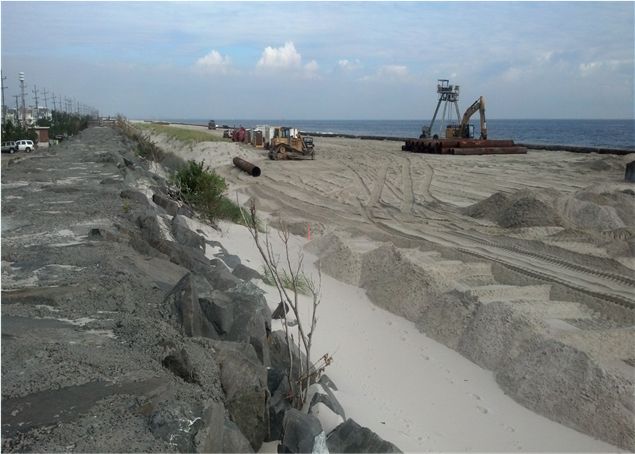
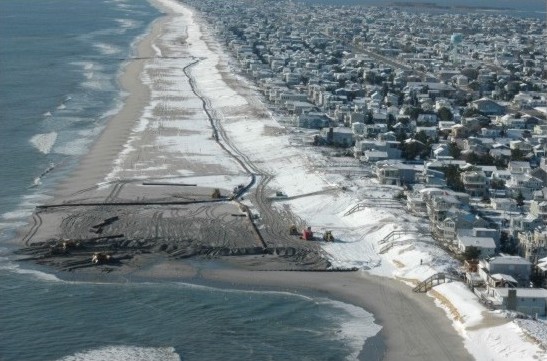
The New Jersey Department of Environmental Protection (NJDEP) authorized the New Jersey Beach Profile Network (NJBPN) project in 1986. The report is divided into four coastal county segments and provides a summary of beach changes for that county. This year is unique in that Hurricane Sandy had such a profound impact on the beach/dune systems of the State, especially in Monmouth and Ocean Counties. Therefore, most of the traditional remarks have been set aside in favor of a focus on what worked, how well things did or did not work to protect or defend public and private development in each county.
All major beach restoration or hard structure projects were reviewed for performance and effectiveness. The seasonal changes are included, but largely in table form in the appendix. The individual site cross sections will show the four surveys, but include a short, immediate post-Sandy survey done between one and 15 days following the storm. Each segment of the coastline was individually published on the Coastal Research Center (CRC) website as soon as it was complete. This report attempts to combine all six Sandy reports plus a review of the seasonal changes prior to Sandy in a summary of this extraordinary event.
Hurricane Sandy: Beach-Dune Performance Assessment of New Jersey Beach Profile Network Sites
The Stockton Univeristy Coastal Research Center (CRC) has initiated a post-storm survey and assessment of the New Jersey shoreline in response to severe beach erosion resulting from the impact and landfall of Hurricane Sandy. Nearly all of the 105 New Jersey Beach Profile Network (NJBPN) sites were surveyed immediately after the storm to provide accurate sand volume losses to New Jersey's beach's. Pre-existing NJBPN monitoring sites were used to provide an accurate comparison and assessment of storm related shoreline and beach volume changes. Using the data from those sites surveyed for fall 2012 NJBPN or spring 2012 provides a good baseline for damages that occurred during the hurricane.
NJBPN County Based Reports
2011 New Jersey Beach Profile Network Annual Report:
Covering 25 Years of New Jersey Coastal Research
2011 Annual Reports (PDF):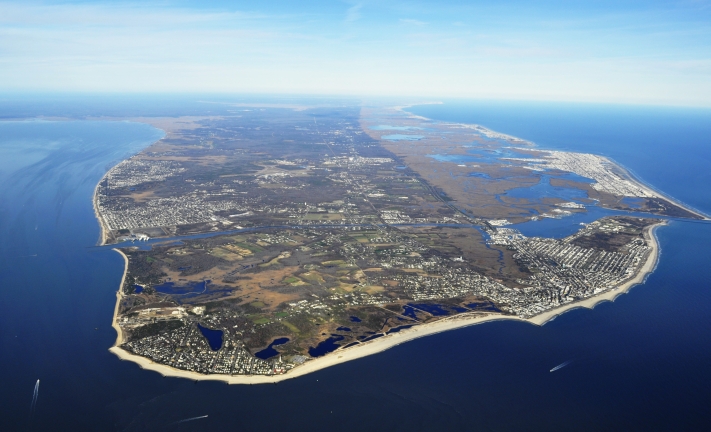
It has been a quarter century since the Division of Coastal Resources within the New Jersey Department of Environmental Protection (NJDEP) requested an initial quantitative survey of the entire State ocean coastline be undertaken. This project remains one of just a few where coastal states conduct repetitive surveys of their beach/dune systems to determine the annual magnitude and rate of change in the sand volume or shoreline position for the entire State’s ocean coast.
In addition to the annual 2010 to 2011 review, this report provides a 25-year shoreline change analysis of each of the 105 monitoring sites and a discussion of the overall trend for each county. Four figures are provided for each site: a full-page photograph of the 2011 shore condition, 2010-2011 cross sections for the dunes, beach and offshore, 25-year cross section comparison between 1986 and 2011 with comparison photographs, and a 25-year trend in shoreline location and sand volume changes.
2010 New Jersey Beach Profile Network Annual Report
2010 Annual Reports (PDF):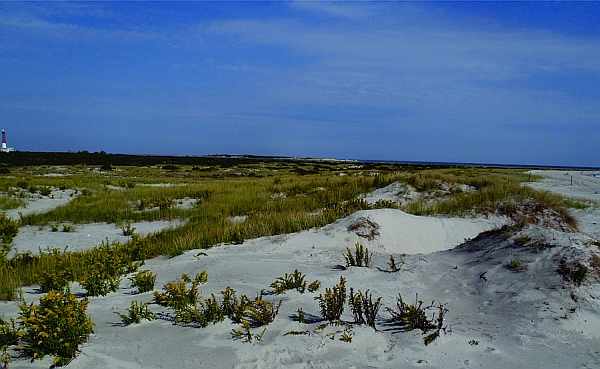
This reporting interval covers the time between the spring of 2009 and the fall of 2010. A new site wasestablished at Lake Tackanassee (Site 272) in Long Branch to better document sand movement to the south.The Pullman Avenue site in Elberon has never demonstrated any significant quantity of material deposited from the northern segment of the Monmouth County fill. The survey data was analyzed and evaluated to show changes in the four county shorelines and sand volume changes for the 18-month study interval.
2009 New Jersey Beach Profile Network Annual Report
2009 Annual Reports (PDF):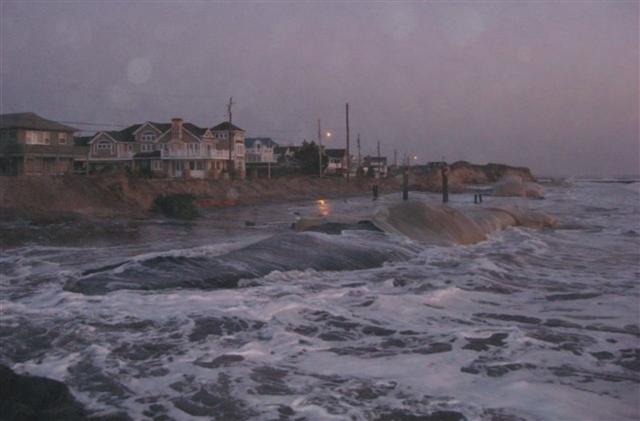
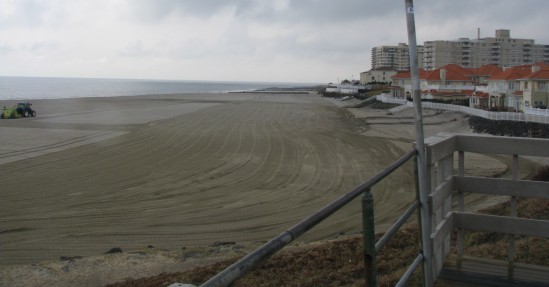
This reporting interval covers the time between the spring of 2008 and the fall of 2009. The average beach in New Jersey gained 0.06 cubic yards of sand per foot of shoreline as the zero-elevation shoreline position retreated -5.74 feet landward between the fall of 2008 and fall of 2009 as taken from the master site tables of shoreline positions and sand volumes for each profile. Many coastal communities resorted to trucking in thousands of cubic yards of quarry sand to bolster damaged dunes to preclude breaching in potential future events. The Borough of Avalon hauled 30,000 cubic yards to the dunes between 17th and 21st Streets where 125 feet of landward retreat had occurred. Long Beach Township likewise hauled sand to multiple sites where the dunes had been all but erased leaving properties with wave swash under them at high tide.
2008 NJBPN Annual Report
 2008 Annual Reports (PDF):
- Introduction
- Monmouth County
- Ocean County
- Atlantic County
- Cape May County
- Volume Tables and Bibliography
This reporting interval covers the time between the spring of 2007 and the fall of 2008. The average beach in New Jersey gained 2.01 cubic yards of sand per foot of shoreline as the zero-elevation shoreline position advanced 9.51 feet seaward. The winter of 2007 to 2008 did not produce significant storms. By March the beaches were showing considerable accretion of sand between the dune toe slope and the water line. There were no northeast events until a series of four commenced in early April 2008. The fourth in the series on May 12th produced minor dune toe erosion and some media concern that the summer season might suffer because of the storm impact on the beaches. However, the weather pattern reverted to conditions favorable for an extensive period of accretional activity. By September 2008 the beaches were in outstanding condition. The winter continued mild into 2009 and for the first time in several years the communities who favor the use of bulldozing of sand from the beach berm back into the dune toe area found that it was not required. The need for beach maintenance was limited to a few erosional hot spots.
2007 NJBPN Annual Report
 2007 Annual Reports (PDF):
This reporting interval covers the time between the spring of 2006 and the fall of 2007. The average beach in New Jersey gained 9.07 cubic yards of sand per foot of shoreline. The winter of 2005 to 2006 did not produce significant storms so that by March, April and May the beaches were showing considerable accretion of sand between the dune toe slope and the water line. The fall of 2006 did generate several minor northeast events starting just after Labor Day and continuing into October. The result was that the fall 2006 survey series shows eroded berm and dry beach areas, not the end of summer accretion. The following winter produced multiple northeast events concentrated later in the spring than expected. They concluded with a solid annual northeaster on May 12, 2008 (Mother’s Day Storm) that cut deeply into the seaward slope of many dune systems, especially those beaches that did not have recent nourishment projects. The impact on the Borough of Mantoloking was to force a community-wide bulldozing effort to restore the dune toe slope after sand partially returned to the berm area. The State’s assessment was to combine the impacts of these events into a declaration that a 5-year intensity “storm” event had affected the shoreline, so bulldozing was a permitted restoration activity.
The summer that followed did produce the most extensive, State-wide accumulation of sand on the beach, derived from the bars or seabed offshore that has been documented in many years. The New Jersey beaches gained and average of 8.08 cubic yards of sand per foot of shoreline during that summer as material was moved onto the survey envelope from points further seaward than the -16 feet of water depth achieved during these surveys. This value was 89% of the total gain for the average NJ beach. Most of this accumulation was due to the offshore passage of tropical systems (Hurricane Kyle) and several non-tropical events in September that passed well seaward of the coast. The average values for the three seasonal sand volume change comparisons for all the sites in each county and the 18-month interval are as follows:
| S 06 – F 06 | F 06 – S 07 | S 07 – F 07 | S 06 – F 07 | |
| Cu. yds/ft. | Cu. yds/ft. | Cu. yds/ft. | Cu. yds/ft. | |
| Monmouth County | -2.28 | -2.37 | -0.67 | -5.15 |
| Ocean County | 16.44 | -5.37 | 2.70 | 32.77 |
| Atlantic County | 7.57 | -3.83 | 5.45 | 8.20 |
| Cape May County | -2.82 | -4.71 | 15.06 | 7.53 |
Clearly the winner was Ocean County and that was without benefit of other than Surf City’s Federally-sponsored beach nourishment to enhance the numbers. No new sand was added to either Monmouth County or Atlantic County sites. Minor additions were made to Ocean City’s (660,000 cy) and Avalon’s (250,000) cy) erosional areas that improved the numbers for the summer of 2007. The final assessment is that the New Jersey shoreline did extremely well over the past 18 months in terms of sand volume on the beach and with shoreline positions providing benefit to the stability of the dune toe. Special evaluations of dunes showed that where studied, the coastal dunes added both volume and height in detectable amounts. The numbers while not large were at least in the right direction.
2006 NJBPN Annual Report
2006 Annual Reports (PDF):
In 1986 the New Jersey Department of Environmental Protection (NJDEP) authorized the formation of the New Jersey Beach Profile Network (NJBPN). This report summarizes the two decades of changes to each of the four coastal counties in New Jersey with the goal to provide a document that gives a thorough overview with enough detail that the reader can understand the nature and trends seen since 1986. These observations on beach changes along the New Jersey coastline provide a means to determine both rapid seasonal changes and follow long-term trends in shoreline position or beach volume. The 100 sites extend from the lower Raritan Bay, along the four-oceanfront county shorelines and into Delaware Bay along the western shoreline of Cape May County.
Previous reports focused on the recent changes as told by the last four surveys at each of the 100 locations. The graphics and text displayed and discussed the seasonal and year to year changes observed since the previous report. This pattern of data presentation is followed on the website as well www.stockton.edu/njbpn. To celebrate twenty years of research, the CRC has generated graphics intended to focus attention on the trends detected in beach sand volume and shoreline position. These trends are then grouped into averages for each county to show rather dramatically the impact of three significant causes for change.- The enormous positive impact of beach nourishment over the past 15 years.
- The beneficial results of the low incidence of serious storm events impacting the NJ coast.
- The enhanced shoreline protection benefits of 20 years of dune growth in height and width.
However, Katrina and Rita vividly demonstrated that for a coastal community to survive these catastrophic events they must be well prepared in advance for the possibility of severe events occurring during any given year. Beach nourishment projects remain the most efficient and effective means available to enhance the dune and beach system to resist storm damage and protect our oceanfront public infrastructure and private properties while ensuring the recreational use of our national shoreline treasures for future generations.
NJBPN - 2005 Annual Reports
 2005 Annual Reports (PDF):
Executive Summary
The New Jersey Beach Profile Network is 20 years old as of the fall of 2006. These
observations on beach changes along the New Jersey coastline have provided a means
to determine both rapid seasonal changes and follow long-term trends in shoreline
position or beach volume. The 100 sites extend from the lower Raritan Bay, along the
four-oceanfront county shorelines and into Delaware Bay along the western shoreline
of Cape May County. Each report focuses on shoreline and beach volume changes presented
as tables, photographs and topographic profiles for each of the 100 locations between
spring 2004 and fall 2005 in this edition. The winter of 2004 to 2005 had a benign
start followed by a prolonged interval of minor northeast storms, which culminated
in moderate beach erosion and some cutting into the toe of the dunes. These conditions
continued into thlate spring and frustrated municipal efforts to get the beaches ready
for the 2005 summer season. While few communities were forced to bulldoze sand back
to the toe of the dunes, there were substantial erosional issues related to the northern
end of barrier islands such as Avalon, Absecon Island, and Long Beach Island south
of Barnegat Light Borough. Modest winter storms in mid-October 2005 created a fear
of a long hard winter, but the weather changed dominated by northwest winds with few
storms and mild temperatures.
The fall 2005 hurricane season was one to remember for the Gulf coast as Hurricanes Katrina and Rita demolished entire resort shorelines for several blocks inland. Hurricane Wilma crossed the State of Florida and damaged both coasts. Fortunately the storms missed the Mid-Atlantic coastline, but 28 named tropical depressions, 15 hurricanes and 4 category five events made 2005 the most active Atlantic basin storm season in history and the most expensive in terms of damages (100 billion dollars and 2,280 deaths). After the last hurricane faded to a tropical depression (Tropical Storm Zeta, Jan. 6, 2006), the northeast storm season failed to develop any significant coastal storms sparing the Mid-Atlantic coast further damage following the mid-October events discussed above.
Following the construction of the Seven-Mile Island Storm Protection project in 2002 and northern Absecon Island in 2004, the US Army Corps of Engineers (ACOE) spent the last 18 months developing final details on a 71 million dollar project for Long Beach Island (LBI). The Philadelphia District also completed work on the Cape May Meadows and Borough of Cape May Point project in the late fall, early winter of 2004 to 2005 with over a million cubic yards of sand pumped onto the Cape May Meadows shoreline for environmental restoration purposes, which continued into Cape May Point as a shore protection effort. In early 2006 the relatively small Brigantine Island project finally went to construction after considerable delay. The upsurge in real estate related issues has plagued both the LBI project and is causing problems for the Northern Ocean County effort as well. The problem revolves around private ownership of the beach to the high tide line conflicting with the use of public funds to benefit private land without gaining public access to the beach built with public money. The refusal by many beachfront lot owners to grant access easements to the State and ACOE in perpetuity to manage the project and perform maintenance is the heart of the conflict. This conflict between some property owners and the public agencies must be solved before these projects can move forward. The rising resistance by Congress to fund large-scale shore protection efforts by the ACOE further complicates the drive to gain 100% coverage for the developed NJ shoreline under Federal project supervision.
The Cape May Point 227 experimental project monitoring the performance of “reef” structures in preventing sand loss offshore along Cape May Point will enter its fourth year. The project compares the 6-foot high “Beachsaver” concrete units with the standardized “Double Tee” concrete parking garage floor-beam units, which are only about 30 inches tall. Both types of “reef” structures reduced erosion.
NJBPN - 2004 Annual Reports
 2004 Reports by County (PDF):
Executive Summary
Five years into the New Millennium, the New Jersey Beach Profile Network report is
approaching its 20th year of observations on beach changes along the New Jersey coastline.
Sites extend from the lower Raritan Bay, along the four-county oceanfront shoreline
and into Delaware Bay along the western shoreline of Cape May County. Each report
focuses on shoreline and beach volume changes presented as tables, photographs and
topographic profiles for each of the 100 locations between spring 2003 and fall 2004
in this edition. The winter of 2002 to 2003 had over 14 individual northeast storms
that impacted the New Jersey coastline with relatively minor damage to dunes and beach
elevations. These conditions continued during the 2003 to 2004 winter with fewer storms,
but with concentrations of events in the mid- to late-spring timeframe. The Borough
of Mantoloking was again forced to undertake a dune restoration program where sand
accumulating on the beach as the storms abated in mid to late June was pushed up to
replace lost sand. Loss was limited to the dune toe and locations prone to erosional
episodes during northeast wave conditions such as some of the groin field sites on
Long Beach Island and the northern end of Seven-Mile Island. The accretional wave
climate commenced in mid-June, but was less effective in building up the beach width
and berm elevation in 2004.
The fall 2004 hurricane season ravaged the State of Florida, but fortunately the storms missed the Mid-Atlantic coastline. As the last hurricane faded to a tropical depression, the northeast storm events took over in a progression of repetitive mild storms. Analysis of weather patterns collected by the US Weather Service at the Atlantic City station showed that in a 517-day period between January 1, 2004 and May 31, 2005 winds averaging 19 MPH came from the northeast during 122 days of the record. The highest 2-minute wind gust was 34 MPH. Therefore, although no event could be classified as a “moderate” or “severe” storm, the frequency of mild events removed large quantities of sand from beach projects where northeast wave-driven impact has been a problem. The Atlantic City, Ocean City and Avalon beaches at the north end of each municipal shoreline suffered berm retreat into the manmade dune. The Ventnor City beach project ended at the Margate City boundary and was subject of north to south littoral currents that transported of much of the southern part of the project beach into Margate.
The level of beach nourishment activity by the US Army Corps of Engineers (ACOE) has subsided recently as funding has become more difficult to extract from Congress and many projects are in the maintenance phase. Progress continues toward construction on Long Beach Island, Ludlam Island, and eventually Northern Ocean County between the Manasquan River Inlet and Barnegat Inlet. Work was completed by the Philadelphia District on the Cape May Meadows and Borough of Cape May Point project in the late fall, early winter of 2004 to 2005 with over a million cubic yards of sand pumped onto the Cape May Meadows shoreline for environmental restoration purposes as well as continuing into Cape May Point as a shore protection effort. The only project set for construction in late 2005 is the relatively small effort along the City of Brigantine’s northern shoreline in Atlantic County. Monitoring and evaluation of performance data continues at both the New York and Philadelphia Districts for planning of eventual maintenance of existing projects.
The Cape May Point 227 monitoring effort on the performance of “reef” structures in preventing sand loss offshore along Cape May Point will enter its third year of five. Results to date favor the 6-foot high “Beachsaver” concrete units over the standardized “Double Tee” concrete parking garage floor-beam units, which are only about 30 inches tall. Both types of “reef” structures perform better than no structure as evidenced by more erosion at the structure-free control beach in Cape May Point.