NJ Shoreline Protection and Vulnerability
 SHORE PROTECTION IN THE STATE OF NEW JERSEY:
New Jersey is considered the most developed and densely populated shoreline in the
country, but out of a 130-mile distance between Sandy Hook and Cape May Point, there
are 31.2 miles of shoreline with no human development between the salt marshes and
the sea. The Sandy Hook National Seashore was established on the northern spit in
Monmouth County, long used for military defense of New York harbor. Continuous development
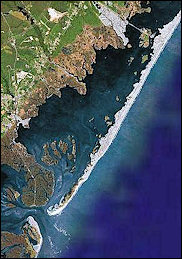
extends from Sea Bright south to Seaside Park in Ocean County. The 10.5-mile Island
Beach State Park provides a nearly pristine coastal environment utilized in ever increasing
recreational and eco-tourist activities. Long Beach Island has the Holgate unit of
the Forsythe National Wildlife Refuge at its southern tip as part of a 10.8-mile gap
in development consisting of Holgate, Little Beach Island and the northern part of
Brigantine Island. Shorter segments of undeveloped shoreline exist on Pecks Beach
(Corson’s Inlet State Park), the Two-Mile Beach Unit; Cape May National Wildlife Refuge,
and the Cape May Meadows in Cape May County. Seventy six percent of the coast is developed,
with intensely crowded public and private land use activities of great economic value
to the State and its citizens.
Shore protection is the science and strategy of devising methods, structures, and
practices that together, promote the art of living safely within a geologically unstable
environment with the constant threat of storm damage. Made of unconsolidated sediments,
the New Jersey coastal zone is not able to resist alteration by waves, tides and storms
that move sediment from place to place. The total absence of bedrock along the shoreline
means that all the oceanfront is vulnerable to be removed and re-deposited elsewhere
over relatively short periods of time.
Protection has involved many different structural solutions beginning with timber
bulkheads and piles of brush contained inside a double row of cedar pilings (early
groins). During the 20th Century truck transportation of large rocks added to the
ability of placing large armor stone along erosional shorelines. Concrete came into
play to create seawalls and other structural solutions. Finally, the development of
large-scale methodology for moving millions of cubic yards of sand from areas of surplus
at inlets or offshore to eroded beaches created the beach replenishment “industry”.
Between 1990 and 2005 over a half billion Federal, State and local dollars were expended
at over 50% of the developed shoreline placing 10’s of millions of cubic yards of
sand on beaches between Sandy Hook and Cape May Point.
36 years of State regulation of the coastal zone has produced a large volume of policy
designed to guide a safer development history especially along the inlet and oceanfront
shorelines. Implemented by the Land Use Regulation Program (LURP) within the New Jersey
Department of Environmental Protection (NJDEP), the shore protection aspect of the
regulation has focused on building design, setbacks from the shoreline and the creation
of a wider beach with a storm resistant dune system built between the development
and the beach. There has been abundant conflict between those who would build right
to the high tide line on the beach and some who would advocate the abandonment of
all public and private development on barrier islands. Since most individuals, corporations,
and municipal governments fall close to the center between that range of positions,
the major battle has been over how large a setback, how wide a beach and controlling
dune growth.
As the Federal/State and local municipal beach restoration program emerged in the
late 1980’s, the wider beaches created by bringing in new sand have reduced storm
damage to public and private property. The first reaches completed under the Federal
program were northern Ocean City to 34th Street and Cape May City, NJ. Ocean City
was completed in the summer of 1992 following the October 31, 1991 northeast storm
which did over $4,000,000 in damage just to the municipal boardwalk and other public
infrastructure along the shoreline. In December 1992 an equally intense event produced
another Federal disaster declaration for New Jersey, but damage to the Ocean City
oceanfront infrastructure was negligible. In Cape May City there was one minor area
of overwash into the community at the very northern oceanfront street intersection.
Following the two early 1990’s northeast storms, the State Division of Engineering
and Construction reviewed the damage history and looked for ways to accelerate the
Federal Shore Protection Program for other New Jersey beaches. In 1994 the NJ legislature
established the “Shore Protection Stable Funding Act” that initially provided $15
million dollars annually for the specific purpose of conducting shore protection projects
along the coastline. The policy was to provide 75% of the project cost with the State
funds, with the local contribution equal to 25% of the project. Following consultation
with the New Jersey Shore Partnership, local coastal public officials, coastal consultants,
public and private, the decision was made to use the Stable Funding Act revenue to
provide the required 35% local partner(s) matching funds to seek future Federal assistance.
With the Federal Government paying 65% of the project cost, the State/local funds
became tremendous financial leverage to proceed with far larger efforts than could
be undertaken by the State and municipal entities alone.
The State and its municipal allies began the process of lobbying the Congress for
authorization of Shore Protection work along the New Jersey shoreline. The Federal
US Army Corps of Engineers (ACOE) is the agency charged with initiating, planning,
designing, and carrying out the construction of these projects. With three distinct
phases required to take a project from concept to construction, the effort proceeded
to get started on nearly every shoreline reach in the State. By far the largest project
was the Monmouth County Shore Protection Project covering 21 miles of shoreline between
the Sandy Hook National Seashore and Manasquan Inlet. The New York District is the
division of the ACOE responsible for Monmouth County. The first step is a Congressional
authorization directing the ACOE to undertake a Reconnaissance Study of the selected
shoreline to determine the nature and magnitude of the erosion or storm damage threat
and recommend moving to the Feasibility Study phase. Federal funds cover the reconnaissance
study, with the State matching funds required for the Feasibility Study that follows.
That study is conducted by the ACOE and is focused on providing engineering, geo-technical,
environmental, and economic answers to the questions raised by the reconnaissance
study. In order to proceed to the next step the Feasibility Report must (among other
things) show a ratio greater than 1.25 when the value of project benefit is divided
by its cost.
The Planning and Engineering Design phase is where the actual project is laid out
and cost documentation with predicted benefits to the region is formulated into a
sizable document that will be used to generate a funding request from Congress to
go to construction. Finally, after approval and signature at Department of the Army
in Washington DC, the project is authorized to go to the construction phase. Most
of the effort is expended in lobbying Congress, pursuing the goals of the project
and seeing that the State is on-board with the project design in order to go from
reconnaissance to construction in less than 8 years. Projects were authorized in rapid
succession for nearly all developed shoreline sections in the State. The political
activism did move the Monmouth County, Absecon Island, and Seven-Mile Island projects
to construction following the initial success of the Cape May City and Ocean City
projects. Work is completed or near complete on the two studies for all other reaches
in the State. Construction funding authorization from Congress has become increasingly
difficult. As the need for beach maintenance has increased, the willingness of the
Congress to fund these projects has decreased with multiple attempts to return the
burden of funding back to the States and local communities. Coastal communities and
economies are clearly important to New Jersey’s prosperity and quality of life, but
they are vulnerable to devastating affects from northeast storms and hurricanes. This
was demonstrated during the 2004 hurricane season in Florida. This threat came to
pass again along the Gulf Coast in 2005, which may continue a 20-25 year long trend
of enhanced activity in the Atlantic basin that began in 1995. This increasing trend
in storm activity coincides with a decreasing trend in Federal funding for shore protection
and beach nourishment. Funding for the 2006 budget proposal is 32% lower than was
proposed for 2005, and nearly 50% lower than was proposed for 2004. Responsibility
for protecting and maintaining the coast is incrementally shifting to the State and
municipal governments.
The details on each of the projects follow in the body of this report under the county
in which they are taking place. New Jersey is pursuing the continuation of projects
already authorized to ultimately achieve their construction status, especially Northern
Ocean County, Long Beach Island, and Ludlam Island. The relatively minor effort on
the northern Brigantine Island shoreline was completed in the spring of 2006. Each
project authorized for construction comes with an agreement to support the maintenance
of the project for 50 years from the date of signature of the final Planning and Engineering
Design documents. At the present moment the Federal government provides 65% of the
maintenance costs as well, with the “local” share at 35% of the project cost. The
“local” sponsor of any Federal project may comprise local, county or NJ State funding
agencies. With the State’s program of 75% cost sharing of coastal projects, the municipal
share of any Federally sponsored project is 25% of the 35% “local” share which amounts
to 8.75% of the total Federal project cost. That means for every million dollars in
project cost, the municipal share of the project is $87,500. This is the fantastic
local economic leverage built into Federal Shore Protection Projects.
The geomorphology of the New Jersey coastline was defined by Nordstrom, 1977 and has
been used to divide the State’s coastline into five distinct zones with different
characteristics. The variation is most dramatic between the bluff where the upland
surface ends at the beach as a cliff in the older sedimentary deposits and the barrier
spits or islands. The bays and lagoons are found to the south of Bay Head, NJ where
the bluff finally is submerged at the edge of the rising sea level and its Holocene
deposits. There are two long sand spits attached at the north end of the bluff (Sandy
Hook) and at Bay Head, extending south to Barnegat Inlet. Tidal inlets occur about
every 10 miles and number 11 from Shark River to Cold Springs Inlet. Finally, a shore
segment of uplands bluff is exposed at Cape May Point where the Cape May County peninsula
extends into Delaware Bay. A detailed discussion on the geologic changes and the present-day
emergence of the New Jersey coastal plain and coastline has been included for a number
of years in previous reports. This information is still found on the website devoted
to the New Jersey Beach Profile Network data generated by the Richard Stockton Coastal
Research Center (CRC)(page 5, 2002-report).
STORM VULNERABILITY ASSESSMENT OF THE NJ COASTLINE:
With the upsurge in intense hurricane activity since 2004, the CRC began to focus
on just how susceptible the New Jersey coastal communities were to storm damage from
dune breaching and overwash during storms. Data on beach elevation and width combined
with dune parameters were factored into an analysis designed to predict just when
a particular storm would breach the beach/dune system and produce damage inland. Research
found initial attempts at quantifying the damage potential from coastal barrier erosion
(Williams & Johnson, 199?) where the national shorelines were categorized as Stable,
Moderately Eroding or Severely Eroding. The northeast portion of the US is displayed
in Figure 1a left, below showing their color scheme with New Jersey shown as severely
eroding along all but Atlantic County’s shoreline. To the right is an illustration
from a 2001 USGS report, which took the analysis of the southern Atlantic shoreline
up a level to evaluate the relative elevations of the primary dune along the coast
with indications of decreased vulnerability to overwash and breaching based on an
increase in dune elevations.
In 2002 the CRC commenced development of a storm vulnerability assessment for the
New Jersey shoreline based on new technology called LIDAR. LIDAR is a laser light
pulse sent from an aircraft to the ground and detected in reflection from the ground
and converted to an elevation based on GPS determination of the plane’s position and
elevation and the time for the light to reach the ground and return to the plane’s
detection system. Digital elevation data with points about every square foot form
a swath along the shoreline from the low tide line back landward of the dunes. Water
penetration is imperfect at present, but is under development and sub-aqueous data
is improving.
The initial project evaluated the relative effectiveness of a stretch of Long Beach
Island dunes in Holgate to storm damage based on width, elevation, seaward slope,
and vegetation density. The dunes were subdivided based on existing oceanfront property
widths and categorized into five classes of increasing ability to resist breaching.
In 2004, the Borough of Mantoloking requested that the CRC evaluate the community
dune system and add the model impact of multiple storms defined by Federal Emergency
Management Agency (FEMA) into probability of occurrence between a 2-year event up
to 100-year storm intensity. Each storm’s defined parameters of wave height, storm
surge elevation, etc, were entered into the ACOE computer program called S-Beach.
This one-dimensional model uses the LIDAR data and offshore NJBPN data to provide
the “existing dune beach conditions” for the test to see if the system can withstand
a particular intensity storm event. If the dune crest is compromised, the determination
is made that dune failure occurs and overwash into the community occurs. Figure 1b
to the right shows the 50-year FEMA storm event imposed on the Mantoloking oceanfront
dunes based on the width of individual oceanfront properties. The digital tax map
was provided by the community and used to segment the 2000-dated LIDAR and digital
aerial photography. Cooler colors indicate dunes that resisted the 50-year storm surge
and waves with the yellow color in the upper set of color bars showing a 90% erosion
to the dune crest. The red color indicates dune failure. The lower set of color bars
shows the relative performance of the dune/beach system among the 141 properties along
the Mantoloking oceanfront. Reds and yellows indicate below average performance, blues
and greens indicate above average with white the average dune performance for a 50-year
storm. This effort is being expanded, funded by the NJDEP Division of Engineering
and Construction to include all of Northern Ocean County on a 250-foot width increment.
Designing this for individual oceanfront property widths proved to be an impossible
task since not every community has or is willing to provide its digital tax map with
geo-referenced coordinates for the project. Work is expected to be complete by June
2007.
This figure illustrates the initial work attempting to quantify the potential for damage to the shoreline by coastal storms and erosion. Williams and Johnson, 1991 and USGS report 2001. *Click to see enlarged image*
 50-year Beach-Dune Erosion Susceptibility for Mantoloking, New Jersey 2004. *Click to see enlarged image*